In statistical analysis, change detection or change point detection tries to identify times when the probability distribution of a stochastic process or time series changes. In general the problem concerns both detecting whether or not a change has occurred, or whether several changes might have occurred, and identifying the times of any such changes.
배경
A Survey of Methods for Time Series Change Point Detection 2017
- Unsupervised Change Point Detection
- Likelihood Ratio Methods
- Subspace Model
- Probabilistic Methods
- Kernel Based Methods
- Graph Based Methods
목차
- Unsupervised Change Point Detection 접근법 중
Likelihood Ratio Methods의 특징을 살펴본다. - 해당 방법론의 기본이 되는 논문을 하나 리뷰한다.
- 파이썬을 사용하여 (2) 논문의 알고리즘을 구현한다.
Likelihood Ratio Methods
보편적인 통계적 Change Point Detection은 포인트를 중심으로 앞과 뒤 분포 차이의 유의성을 비교하는 방식으로 진행된다. 그 중, Likelihood Ratio Method는 포인트를 중심으로 한 두 연속적인 인터벌의 logarithm of the likelihood ratio를 모니터링하며 Change Point를 찾아낸다.
Two Step Algorithm
- 두 구간의 확률 분포를 각각 계산한다.
- 확률 분포 차이의 비율을 계산한다.
Species of Likelihood Ratio Methods
- Cumulative Sum
- accumulates deviations relative to a specified target of incoming measurements and indicates that a change point exists when the cumulative sum exceeds a specified threshold
- Change Finder
- Fits an Auto Regression (AR) model onto the data to represent the statistical behavior of the time series and updates its parameter estimates incrementally so that the effect of past examples is gradually discounted
- direct density-ratio estimation
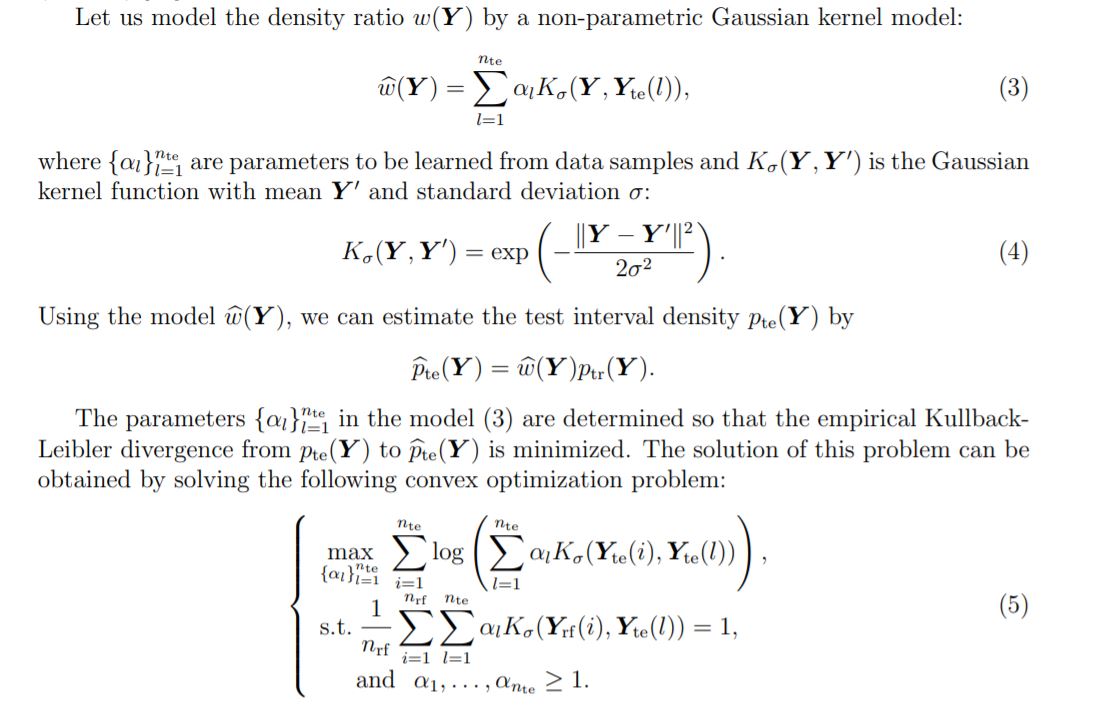
- model the density ratio between two consequent intervals χ and χ′ by a non-parametric Gaussian kernel model
- α-relative density ratio estimation
- reduced to a plain density ratio if α = 0, and it tends to be “smoother” as α gets larger
- Semi-Parametric Log-Likelihood Change Detector
- semi-parametric change detector based on Kullback-Leibler statistics
Change Detection 방법 중, Likelihood Ratio Method만 보더라도 정말 다양한 방법과 statistic을 활용하여 모델링을 수행한다는 것을 알 수 있다. 그 중, (1)과 (2)의 방법은 rely on pre-designed parametric models하다는 한계점을 가지고 있다. 또한 (4)와 (5)는 direct density-ratio estimation 방법의 응용이라고 볼 수 있다고 하니, (3)번 방법론을 소개한 논문을 하나 살펴보도록 한다.
Direct Density-Ratio Estimation
논문 링크: Sequential change‐point detection based on direct density‐ratio estimation(2011)
Abstract
estimate the ratio of probability not the probability densities themselves. (← 방향의 측정은 가능하지만 그 역은 성립하지 않는다) online 상황에서도 효율적으로 적용가능한 direct density-ratio estimation 기법을 제안한다.
Introduction Change Point Detection에서 가장 일반적이라고 볼 수 있는 방법은 과거 구간 X와 현재 구간 X’의 확률 분포를 각각 구한 후, 그 둘의 발산 정도를 계산하는 것이였다. KL-divergence 등의 statistic을 사용하여 the logarithm of the likelihood ratio를 측정하는 CUSUM GLR 등의 기법들이 사용되어 왔다고 한다. 그런데 이런 과거의 기법들은 pre specified parametric model이나 some specific quantities에 의존하여 Change Point를 찾는 한계점이 존재했다. 따라서 논문이 목적하는 바는 모델에 대한 딱딱한 가정 없이 현실 세계에 적용한 non-parametric method를 고안하는 것이다.
그러나 KDE 등을 사용하여 non-parametric하게 분포를 직접 추정하는 것은 어려운 일이다. 따라서 확률 밀도를 직접 계산하지 않고 인터벌간의 비율만을 계산하는 방식을 적용한다. 최근(2011년 기준) direct density-ratio estimation 기법 중 괜찮은 것이 Kullback-Leibler Importance Estimation Procedure (KLIEP) 라고 하는데, 논문에서는 이것을 online 상황에서 적용할 수 있는 알고리즘으로 개선하고 Change Point Detection Task에 적용해본다.
Problem Formulation
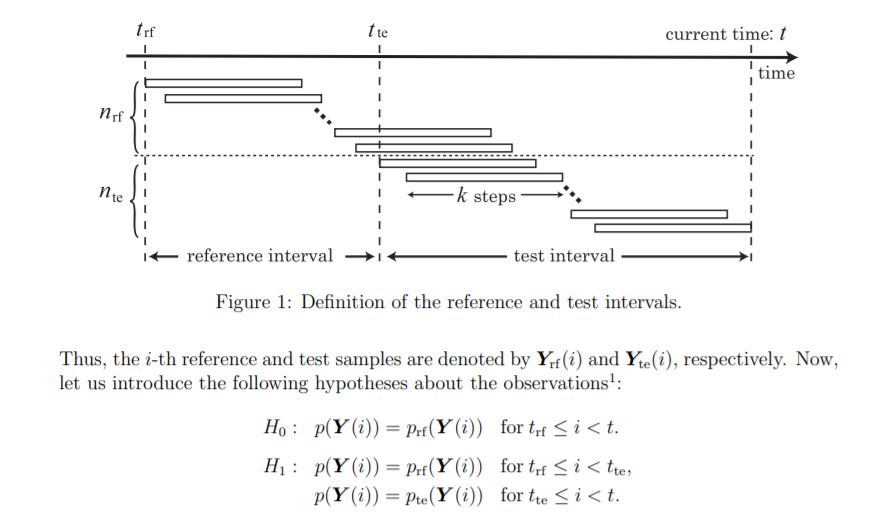
- Y(t)는 k 길이의 sequence data
- logarithm of the likelihood ratio of sequence s(Y) = ln( p_te(Y) / p_rf(Y) )
- p_te(Y): probability density functions of the test sequence samples
- p_rf(Y): probability density functions of the reference sequence samples
test와 reference 각 interval 안에서의 확률 분포는 어떤 샘플을 뽑던 동일하고
test와 reference 간의 확률 분포는 동일하지 않다면
t_te가 바로 change point가 된다.
likelihood ratio test의 컨셉을 이해했다면 test statistic을 이해할 수 있다. 귀무가설이 되는 것이 모든 구간의 샘플을 뽑았을 때의 확률 분포가 reference interval의 확률 분포와 동일하다는 것이니, Test Interval의 샘플들이 분포가 일정하게 유지되는지 확인하면 된다.
그러나 non parametric density estimation을 계산하는 것은 복잡한 과제이다. 따라서 Ratio Statistic을 분포를 추정한 후 대입하여 얻지 말고, 분포간의 비율만을 계산하여 얻자.
Direct Density-Ratio Estimation
논문에서 표현이 혼용된 부분이 있는데, Traing Interval과 Reference Interval이 동일한 개념이다.
위의 식이 어떻게 도출되는지는 해당 논문보다 Kullback-Leibler Importance Estimation Procedure (KLIEP)가 처음 고안된 링크에서 자세히 설명해주고 있다. 요약하자면,
Train Interval의 값을 어떤 모델 w로 태워서 Test Interval의 밀도 te`을 추정할 것인데,
실제 밀도 te의 기댓값을 사용하여 KL(te/te`) divergence을 최소화하도록 모델 w을 학습할 것이다.
첫 번째 텀은 학습할 수 있는 파라미터와 독립적이기 때문에 뒤에 것만 극대화해주면 된다.
(작성중 … )


